1)How do I know what stock is trading under what? for instace if somebody recommens JJD (JOE, JOE DIRTS-I made that up-lol) and now I put that symbol in, its doesnt tell me what exchange its under
2) when I use my stock screener, Ive been, just selecting all 4, so does each exchange have a separate purpose, since im in penny stocks, is there a particular exchange I should be in???
Posts: 189 | Registered: Nov 2007
| IP: Logged |
If you notice right above apple's quote it says APPLE INC (NasdaqGS:AAPL)
You can type in any symbol where it says get quote at the top left
Also you can use barchart.com......type in the symbol in the top left. Barchart tells you what exchange it's in...also you can click on sector on the left hand side and it will tell you the sectors it's in!
posted
Your welcome...don't be afaraid to ask any question on this board, the people that take the time to come here are usallly the ones that want to help. Nobody will think any question is stupid, cause we all asked the same ones before!
Posts: 2321 | Registered: Aug 2006
| IP: Logged |
posted
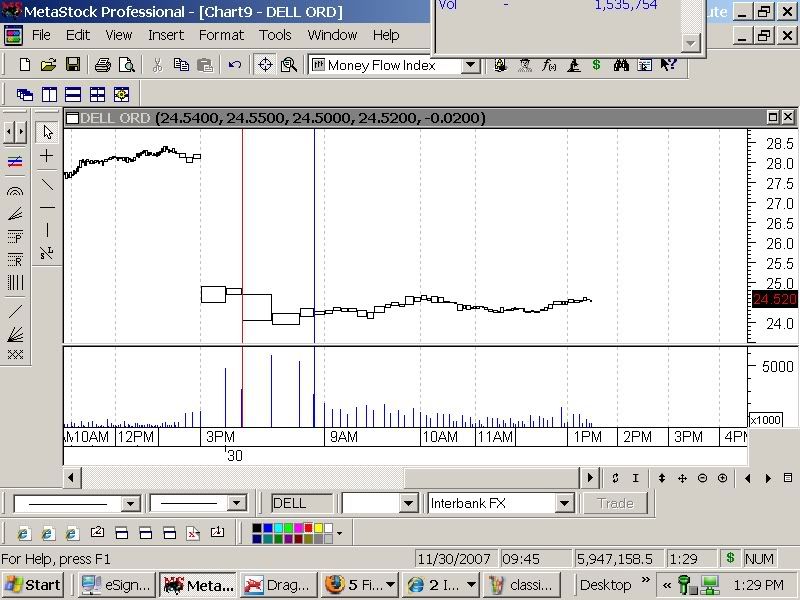
biker, I think I have the capabilities to bring up a chart that will show you what a bar chart looks like with volume.
Look to the right of the red perpendicular line, You can see, it looks like a box, and it is larger than the rest of the bars, this is where your panic selling kicked in.
Next bar, you see to the right looks like a rectangle. This represents a bar that is losing volume. In comparison to the previous bar. Which represents a possible bottom. The next bar after it confirms that it is the bottom for that particular donward leg. I could put in the Bollinger Band and a couple of other indicators that would also confirm this , but I just wanted to show you what they look like.
This bar or volume bar is actually a system.
I also have the capabilities of showing you what a candlestick volume bar looks like.
posted
HMMM that is interesting, but I have to be honest, I have no idea how you know if that box is people selling or buying, but I havent been using the bars at all, so I will go try that on the volume in some of my charts and then throw the candle stick on, well hopefully this weekend I will beable to make my 2nd stock pick
P.S. is that a hourly volume bar chart chuck
Posts: 189 | Registered: Nov 2007
| IP: Logged |
posted
Biker, As I said, this is actually a system or program. Each bar represents a story. In this particular case, it took a considerable amount of volume just to move the price down.
If you look at the box again, notice the high for that day. Actually did not go over the low from the previous bar. To me, that is a downward selling pressure, also the price closed almost at the low that day. That is a dead giveaway that you had more selling pressure than buying pressure.
But as I have said, it took so much volume just to move it down to the low of that particular bar. With that much volume involved, It should have went lower--a lot lower. Hence,you have a bottom formation-- confirmed by the next bar- which looks like a rectangle.
I hope this explains how I came up with more selling pressure than buying pressure or panic selling.
Before I forget it,this is a five minute chart. Also do not get confused with the readings at the bottom of the chart disregard those readings such as 3 p.m. 9 p.m.. So forth and so on. ----------------------------------------------- Disclaimer: In regards to possible legal issues, be advised:
The above information is not a recommendation from myself to others to buy or sell, nor does it provide to other individuals a recommended timeframe for the entry,exit for a stock transaction.
Any individual can use the information as they so choose, but in doing so, that individual accepts full responsibility for results from the use of the information.
I, Chuck, can accept no responsibility or liability for any other person's use of the information for their personal trading. -------------------------------------------------------------------------------- ------------


 UBBFriend: Email this page to someone!
 Printer-friendly view of this topic