Most of my picks will be coming from premarket hour versus the prior days low, high or close.
This will be a percentage difference from the premarket hour data versus the data from the prior day.
Example: If a stocks low was $10 yesterday, and the premarket hours for today was 10% lower. Something has happened to that stock.
The following are different scans that I can do. 1). Consolidation breakout scans, using the Bollinger band.
2). Resistance breakout and support breakdowns.
3). "V" thrust scans. This is when the stock is moving in a up-trend, then it pulls back for three to seven days and then starts back up forming a "V".
4) cross over moving averages with correlation indicator for better signals.
5). Bollinger band breakout reversal signals. Formula = (C-BBandBot(C ,15,S ,1.5))/(BBandTop(C ,15 ,S ,1.5)-BBandBot(C ,15 ,S ,1.5 ))=1.05 AND MFI(14)=50 AND ( BBandTop(C ,20,S, 2)- BBandBot(C ,20 ,S ,2))/Mov(C,20,S)=.08 This will be a reversal to the upside.
The above formulas are just a few that I use from time to time.
-Just a basic outline of how I select picks. Chuck
Posted by T e x on :
logical...
like the name!
Posted by chuck9 on :
10/4 dude. chuck
Posted by wdcisco on :
I like your sig now.. (the ants gone)
I will be checking in Chuck...this is something I need to learn...
Good luck~!!
Posted by Ace of Spades on :
This is a great idea for a thread chuck....keep up the good work and research! I hope you stay at allstocks for a while! Your contributions are apprecitated!
Posted by Jo4321 on :
I'll be watching this thread and try to learn some things from you. I need to stay in the big board stocks; lost too much on pennies in the past.
Jo
Posted by chuck9 on :
I am hoping for the best for all of us, time will tell. chuck Posted by wdcisco on :
LMAO!!! THE ANT IS BACK! Posted by Ace of Spades on :
quote:Originally posted by Jo4321: I'll be watching this thread and try to learn some things from you. I need to stay in the big board stocks; lost too much on pennies in the past.
Jo
Joe you can still make 100's of percent a year on the big board stocks! If you would have bought AAPL, GOOG, RIMM, GRMN, BIDU, or FSLR every time their RSI hit 30, Or other indictors showed they were oversold, you could have made 100's of percent return every year. especially if you use margin. With these great stocks, the charts never lie...they move right with the DOW!
Posted by chuck9 on :
Been working on the-- V --- formula this weekend. Did some back testing, and it was looking pretty good. Then I started having some problems.
This particular formula would be in an uptrend, then it retraces for three to seven days before starting back up. In doing so it forms a --- V -- pattern.
This formula works pretty good, but on a very short-term basis. Less say one to three days.
Posted by chuck9 on :
dell, it would appear that dell has a confirmed break down below 25.90 or around that area. With no real support below, except maybe for around 23.70.
We'll be keeping an eye on it this morning for a pop up. chuck Posted by chuck9 on :
brake down is 24.90 era from the above post.
Posted by Jo4321 on :
Check out PAY. OUCH!
(and, yes, of course I own it.)
Jo
Posted by chuck9 on :
Been there before.
Dell, did not pull back as much as I anticipated it to do. But the ride down was still very nice. chuck Posted by chuck9 on :
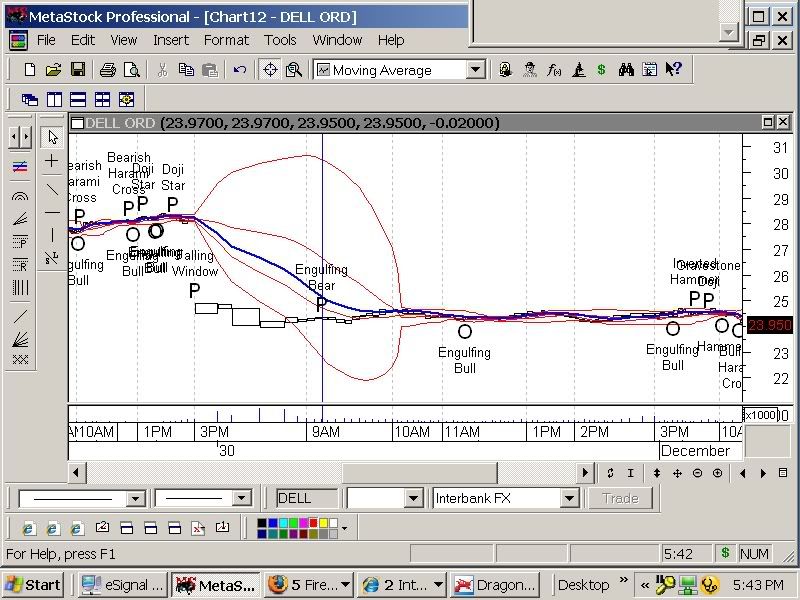
Following is a chart on Dell. Notice the ---Dogi indicator right before the stock broke down. This is a very powerful down signal in candlestick charting.
Also look at the falling window indicator time to go in with a short. After one has went in for a short. It depends on the individual when he or she wants to come out. There were no cover signals until later on in the chart.
Posted by chuck9 on :
If any of you guys like volatility I think ---Pay--- will be the stop looking at.
chuck Posted by chuck9 on :
Posted by chuck9 on :
The following would be a walk-through on how this stock should have been traded.
Posted by chuck9 on :
The following is for the above chart. -------------------------------------
The following would be a walk-through on how this stock should have been traded.
The following are the indicators I used on this chart. 1).A moving average expotential band represented by a big blue line and a big red line.
2). The Bollinger band represented by three small red lines.
3). The candlestick charting indicators.
The first candlestick pattern is a bullish hmrami cross. This particular is a buy signal. But one would not buy for this reason, it did not cross the Bollinger bands 20 day moving average and close above it, also it did not move up to or beyond the blue line moving average.
The second candlestick pattern is a ingulping bear pattern. This is a sell signal to the downside. Reason being, it close lower than the previous bar. It's high did not break the 20 day moving average of the Bollinger band and it also hit the big red line.
The third pattern was a ingulping bull pattern , which is a buy signal. But on further examination. I found out it to be a false signal. Reason being, it did go through the big red line, but did not penetrate the big blue line, which is your moving average band.
The fourth signal came with a--DOJI--star, which is a major downward move with this particular setup, at that point, one should be safe on this complete down pattern . There is a couple more down candlestick formations, but I will not go through them.
The final pattern came as a ingulping bull pattern, which is a buy signal. But this pattern is different from the other bull gulping patterns. It cross above the 20 day Bollinger band moving average and it also cross the blue line. Just to be safe, one would look at the next five min-bar to make sure it close higher than the one that had the ingulping pattern. chuck Posted by chuck9 on :
Another followed through, disregard the readings at the bottom of the chart. Example 2 p.m. 3 p.m. 9 a.m., they mean nothing. I sure hope that's all it. chuck
Posted by chuck9 on :
Went back after ---Pay--- this morning. Looking for low around 23:95 through 23:44. ------------------------------------------------ In regards to possible legal issues, be advised:
The above information is not a recommendation from myself to others to buy or sell, nor does it provide to other individuals a recommended timeframe for the entry,exit for a stock transaction.
Any individual can use the information as they so choose, but in doing so, that individual accepts full responsibility for results from the use of the information.
I, Chuck, can accept no responsibility or liability for any other person's use of the information for their personal trading. -------------------------------------------------------------------------------- ------------
chuck Posted by chuck9 on :
Steel tracking. So far, the low has been 24.05 wondering whether the market being up this morning is keeping the stock up? chuck Posted by chuck9 on :
Have anyone you guys been tracking ---PAY--- has seen a lot of moves down before, but nothing like this. chuck
Posted by Free Muney on :
ive been watching. this stock is so incredibly oversold right now but somehow keeps falling... it is so overdue for a bounce but im scared to catch a falling knife. should be a good bounce imo. financials get released today according to etrade. should be interesting....
Posted by Free Muney on :
ok convinced myself that buying will ensue after fin. are released.
in at 20.85. stop * 20 even. this is going to bounce. i just dont want it to bounce next week after i have lost 25% of my principal.... *crossing fingers tightly*
Posted by chuck9 on :
Think I will give it a little more time.
Good luck, the reason behind this. It just broke through a 21.18 support line, which now becomes the resistance line. -------------------------------------------- In regards to possible legal issues, be advised:
The above information is not a recommendation from myself to others to buy or sell, nor does it provide to other individuals a recommended timeframe for the entry,exit for a stock transaction.
Any individual can use the information as they so choose, but in doing so, that individual accepts full responsibility for results from the use of the information.
I, Chuck, can accept no responsibility or liability for any other person's use of the information for their personal trading. -------------------------------------------------------------------------------- ------------
chuck
Posted by Ace of Spades on :
WTF.. Charts don't mean jack chit with news like this!!!
You should freshing up your D.D. skills.....
1. On November 29th VeriFone EVP Exercises Options, sold 10,000 shares on the same day for $44.39 to $46.41 each.
I don't think you're ready yet for your own thread called "Chuck's "BIG" Board Picks"
First off, you always say the pick after the fact...or say "this is how the stock should have been played"
Daaaaa....we all know how a stock "should have been played after it already happened
If you want to call this Chucks Picks..then make some picks in advance for christ sakes!
You said you were looking for a low around $24 without even knowing what's been going on?
This company's CEO pulled an ENRON type scam! Posted by PCola77 on :
Geez ace, where'd that come from? First of all he was looking for under $24 yesterday at the open, obviously didn't play it, and then just said he's watching it but isn't in.
You know that people have different trading styles. Some people play charts, and DD is irrelevant. Tell me you've never seen a Q stock boucne hundreds of percent. "DD" tells you to stay the hell away from it, but maybe something in the chart signalled a buy, and you made a few bags. What's wrong with that?
Posted by Ace of Spades on :
Where did it come from....I'm the only one that posted DD on the stock that they are so puzzled about...
Free Muney, cannot find the financial statements, you are referring to. Can you help me out on this one?
chuck Posted by chuck9 on :
Disclaimer information:
I do not give exit or entry points in stocks. Reason for this, legal issues that can arise. Although I did do it one time, but that will not happen again.
The following is my--- disclaimer --- I try to put it on every thread I post. ------------------------------------------------- In regards to possible legal issues, be advised:
The above information is not a recommendation from myself to others to buy or sell, nor does it provide to other individuals a recommended timeframe for the entry,exit for a stock transaction.
Any individual can use the information as they so choose, but in doing so, that individual accepts full responsibility for results from the use of the information.
I, Chuck, can accept no responsibility or liability for any other person's use of the information for their personal trading. -------------------------------------------------------------------------------- ------------
Posted by IMAKEMONEY on :
chuck9 WHAT DO YOU THINK OF PFG? WENT DONW IN A/H. INSIDER SELLING,HMM BUT HELL THE GUY MADE A GREAT PROFIT.
Posted by chuck9 on :
Imakemoney, Will be glad to give you the --TA ---, if that's what you are asking. chuck Posted by IMAKEMONEY on :
THANKS, LOVE TO HEAR IT/ READ IT.
Posted by chuck9 on :
Will try and get it for you tonight.What I like to do is to have a chart of the symbol and then put in what needs to be there and give you a brief explanation on what's going on. chuck Posted by wdcisco on :
What do you think of BIOM chuck??? I need your expertise... Posted by chuck9 on :
The uptrend line is the thick orange line. Support line that was your resistance line is thick gray line. Moving average band consist of small blue and red lines.
At present time the stock is touching the uptrend line and the small blue band. If the stock penetrates and closes above this line for 2 consecutive days this is considered a buy signal. For the uptrend line and the support line--read the following info--
PFG broke above the upside resistance level of 63.57 one day ago. This is a bullish sign. This previous resistance level of 63.57 may now provide DOWNSIDE SUPPORT. Volume on the day of the breakout was neither extremely heavy nor extremely light providing no convincing evidence either way as to the validity of the breakout.
The most recently confirmed up trendline for PFC has an ending point currently at 66.32. Expect prices to have some difficulty falling below this trendline. A break below this trendline (particularly on heavy volume) would be a bearish sign.
Weekly chart is in a consolidated period beginning at 10/5 to present. Cannot get a good read on this chart.
It is obvious the stock is at a 52 week high. Could put additional indicators in, but would be too much to digest. They would basically support the same info. The following is a chart of the above information.
------------------------------------------------ In regards to possible legal issues, be advised:
The above information is not a recommendation from myself to others to buy or sell, nor does it provide to other individuals a recommended timeframe for the entry,exit for a stock transaction.
Any individual can use the information as they so choose, but in doing so, that individual accepts full responsibility for results from the use of the information.
I, Chuck, can accept no responsibility or liability for any other person's use of the information for their personal trading. -------------------------------------------------------------------------------- ------------ Chuck Posted by chuck9 on :
Money, Took another look and found a pretty strong resistance line around 68.75 area. Let me explain further--narrow blue band is a 10 day moving average high. Narrow red band is an 8 day moving average low. chuck
Posted by chuck9 on :
cisco,have just started with your chart
Posted by chuck9 on :
Cisco, You have a down trendline with a ending pont of .89 . you will havt to break through this line for more upward movement.
You also have a resistance line .72 represented by the big blue line. you also have a support line represented by a big red line, which is around .53
At this particular time you have penetrated the small blue line. Which is a 10 day expotential moving average high, if you stay above this line 1 more day. This will be considered a buy signal. If you go below the small red line, which is a 8 expotential moving average low, for more than two days, this is considered a sale signal.
The large width of the bands suggest high volatility . Therefore, the probability of volatility decreasing and prices entering (or remaining in) a trading range has increased for the near-term..
chuck
Posted by chuck9 on :
Posted by chuck9 on :
Cisco, when I said, the width of the bands. I was referring to the Bollinger bands. chuck
Posted by IMAKEMONEY on :
Cisco, did you go in on Biom? chuck
Posted by chuck9 on :
Took a hit Friday, Guys. --- OUCH --- Chuck Posted by wdcisco on :
quote:Originally posted by chuck9: Took a hit Friday, Guys. --- OUCH --- Chuck
Chuck,
Thanks for the info man....I did get in BIOM at .59 and .67....I should have sold at .69--resistance...But I was being to greedy I have to be more disciplined and sell sell sell at resistance...
Monday is going to be interesting...Wish me luck!
Posted by chuck9 on :
You got it dude. See you Monday. Chuck Posted by Free Muney on :
another good site for this kind of investing, dummies it down nicely... stockta.com
doesnt list pinkies or otcbb very often but for the Big Boards its pretty comprehensive... imo.
especially for resistance lines and ta signals.
Posted by Ace of Spades on :
quote:Originally posted by Free Muney: another good site for this kind of investing, dummies it down nicely... stockta.com
doesnt list pinkies or otcbb very often but for the Big Boards its pretty comprehensive... imo.
especially for resistance lines and ta signals.
Great site, Thanks!!!
Posted by chuck9 on :
Muney, need to check this site out myself. Thanks for the info. Chuck Posted by chuck9 on :
Symbol--Pay-- just completed running a four point retracement. First retracement I see is around 26.37 a retracement of 25%. ------------------------------------- In regards to possible legal issues, be advised:
The above information is not a recommendation from myself to others to buy or sell, nor does it provide to other individuals a recommended timeframe for the entry,exit for a stock transaction.
Any individual can use the information as they so choose, but in doing so, that individual accepts full responsibility for results from the use of the information.
I, Chuck, can accept no responsibility or liability for any other person's use of the information for their personal trading. -------------------------------------------------------------------------------- ------------
chuck Posted by chuck9 on :
Premarket hours: MEDX --- down 22% price. $10.31. Time 7.53 Central-- this could be a candidate for a short position. -------------------------------------------------
In regards to possible legal issues, be advised:
The above information is not a recommendation from myself to others to buy or sell, nor does it provide to other individuals a recommended timeframe for the entry,exit for a stock transaction.
Any individual can use the information as they so choose, but in doing so, that individual accepts full responsibility for results from the use of the information.
I, Chuck, can accept no responsibility or liability for any other person's use of the information for their personal trading. -------------------------------------------------------------------------------- ------------ Chuck Posted by chuck9 on :
Been a nice run so far this morning to the down side---MEDX ---- time 9:20 Central. Price 10.85 Posted by Ace of Spades on :
quote:Originally posted by chuck9: Been a nice run so far this morning to the down side---MEDX ---- time 9:20 Central. Price 10.85
but it was 10.21 when you made the post...that's a loss if you shorted it lol!
Posted by chuck9 on :
ACE--You're going to have to be able to read time. I said it was 9:20 Central. I am a hour behind you can't you get that man. Besides that, I did not go into the stock at 10.20 or 9.20 Central. If you really have to know and it appears that you do. That is when I came out. And at that particular time, the price was $10.85. Now since I said that. My short entry was $11.30 with 3 thousand shares. I had an exit at 10:85 My profit was 1,350 minus commissioned. Now you had the same opportunity I did, what was your profit? Go back and look when I posted this stock , it was 7.53 AM central. chuck Posted by BooDog on :
WTG Chuck. Nice play.
Posted by chuck9 on :
Thanks BOO. But let me apologize to all of the board. I will try not to let this happen again. After I thought about what ACE said ,I'm sure he meant It in fun . chuck Posted by Free Muney on :
big board post.... been following the housing crash debacle and its been showing some signs of breaking the down trend. DHI in particular has broken its strong down trend this past week.
now I am not implying the trend is over. but this maybe a great sector bounce play. additionally many housing stocks pay dividends. so keep these on the radar. DHI, LEN, BZH, and PHM are the ones i've been following in particular.
Posted by chuck9 on :
Thanks Muney sure will. Just looked at the dow and it wal down -171 in a flash. chuck Posted by Ace of Spades on :
quote:Originally posted by chuck9: ACE--You're going to have to be able to read time. I said it was 9:20 Central. I am a hour behind you can't you get that man. Besides that, I did not go into the stock at 10.20 or 9.20 Central. If you really have to know and it appears that you do. That is when I came out. And at that particular time, the price was $10.85. Now since I said that. My short entry was $11.30 with 3 thousand shares. I had an exit at 10:85 My profit was 1,350 minus commissioned. Now you had the same opportunity I did, what was your profit? Go back and look when I posted this stock , it was 7.53 AM central. chuck
LoL...you are funny...I got the time down fine. I know that was the price you got out! That's my point! You posted another trade after it already happend! Why not post you entry? Anbody can look at the premarket losers and say good short opportunity! and then if it goes down after open say..."I made money"
Posted by chuck9 on :
MEDX -- broke through the resistance line today of 11.39. with high volume. Cannot find any support line. Will keep my eye on this one for tomorrow. chuck Posted by chuck9 on :
Cisco, did you get any of the action today on--- MEDX ---? as far as that goes did anyone short this today? chuck
Posted by chuck9 on :
test for time format. Further post times for me will all reflect central time. Hope this clears up the confusion concerning time of my post. Chuck
Posted by Ace of Spades on :
quote:Originally posted by chuck9: test for time format. Further post times for me will all reflect central time. Hope this clears up the confusion concerning time of my post. Chuck
LoL..there never was any confusion with the the timezone...just your posting style and the point at which you choose to post your exits....after it happens, which anybody can do....
Posted by wdcisco on :
quote:Originally posted by chuck9: Cisco, did you get any of the action today on--- MEDX ---? as far as that goes did anyone short this today? chuck
No...I have been busy with AFT...picked up some more today at .28..LOTSA insider trading!!
Posted by chuck9 on :
MEDX-- looking good this morning. chuck Posted by wdcisco on :
AFT lookin' good this mornin !! and DANKY!
Posted by chuck9 on :
That sounds cool to me. I hate to but I must get over to Ameritrade and talk to them about some back testing procedures. After 10 a.m. Central. Things seem to slowdown. Oh well, that will give me time to fuss with Ameritrade. chuck
Posted by wdcisco on :
lol...good luck with that chuck...! Posted by chuck9 on :
BIIB -- dropped 28.70% price 54.10 possible. Short play -- watch for a pullback to the upside
NBIX -- dropped 43% price 5.85 possible short
[ December 13, 2007, 08:54: Message edited by: chuck9 ]
Posted by chuck9 on :
BIIB--slam dunk and good buy-- chuck Posted by chuck9 on :
Follow-through on the stocks I picked this morning.
BIIB --- had very good down potential for short, but it also had the pulled back that I mention this morning. At lease a dollar range between the high and the low.
NBIX -- Little to say about this one, except that it was a very, very good short. In reality it went exactly by the book. chuck Posted by chuck9 on :
Posted by chuck9 on :
NBIX --- looking to go in for a buy at 3.96 through 4.42. See resistance area of around 4.42. Do not know how strong it is.
In regards to possible legal issues, be advised:
The above information is not a recommendation from myself to others to buy or sell, nor does it provide to other individuals a recommended timeframe for the entry,exit for a stock transaction.
Any individual can use the information as they so choose, but in doing so, that individual accepts full responsibility for results from the use of the information. -------------------------------------------- I, Chuck, can accept no responsibility or liability for any other person's use of the information for their personal trading. -------------------------------------------------------------------------------- ------------
chuck Posted by chuck9 on :
At this point in time the price seems to be hovering around the resistance line. Very interesting. chuck Posted by chuck9 on :
I guess it's about time to leave the land of Oz. See you guys Monday, everyone have a nice weekend. chuck Posted by Free Muney on :
chuck were biib and nbix shortable?
atleast nbix for most pharmas i cant short em on etrade.
but they limit me a bunch on shorting. one day i can another day i cant...
do u know the rules on this or is it just e-tard that is a pain.
Posted by chuck9 on :
MUNEY -- I shorted BIIB, but did not try the other. Will have to excuse my snowman, but since I was answering your post I thought I would try it out and see how it work. chuck Posted by chuck9 on :
Coding is still wrong,with snowman. chuck
Posted by chuck9 on :
Still no picks this morning. Appears that everything has went to sleep. chuck
Posted by chuck9 on :
NO picks today. chuck
Posted by chuck9 on :
Symbol -- ABK -- has a trading range from 29.92 down to 22.30. Also has very good volume within the range. Just a FYI. chuck
Posted by chuck9 on :
Tried to short at 26.90, no shirt no shares available, Ameritrade. chuck
Posted by Jo4321 on :
Tried to go long at $25.00. Came down to within 12 cents. Darn.
Posted by chuck9 on :
We both came close this morning. I saw exactly where you were at, I had a four point retracement set on the stock. The last retracement line was about 61%, pullback. That was very close to where you had your buy position. Nice position pick.
chuck
Posted by chuck9 on :
ABK -- stop at the 20 day moving average of the Bollinger band yesterday, before moving back up. I tried to short it at 26.90, no shorts available. Today, I think I'm going to try and find a bottom and then go in with a buy. Looking for at least $.20 on the dollar. chuck Posted by chuck9 on :
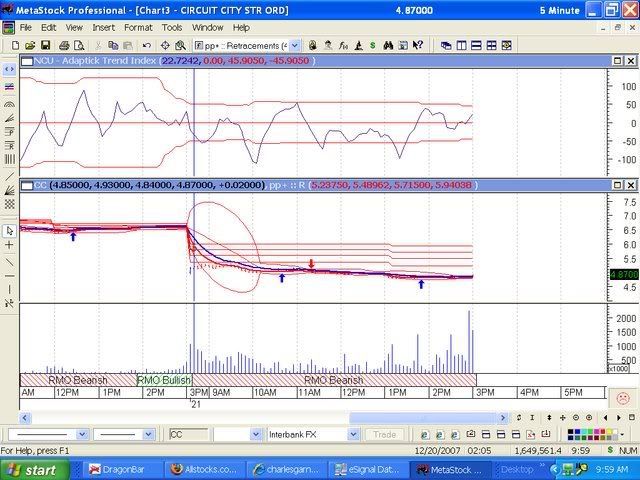
CC -- down 26% price 4.90 missed the quarterly report.
Posted by Free Muney on :
ano is looking good for next week, great consolidation. take a peek
also atvi is on a breakout from great news. has a bunch of huge titles in the videogame world that should be increasing their income for years. good long term hold. imo.
Posted by Fuzzy1018 on :
Check out MBI went down from $28 to $19 in 2 days.
Posted by chuck9 on :
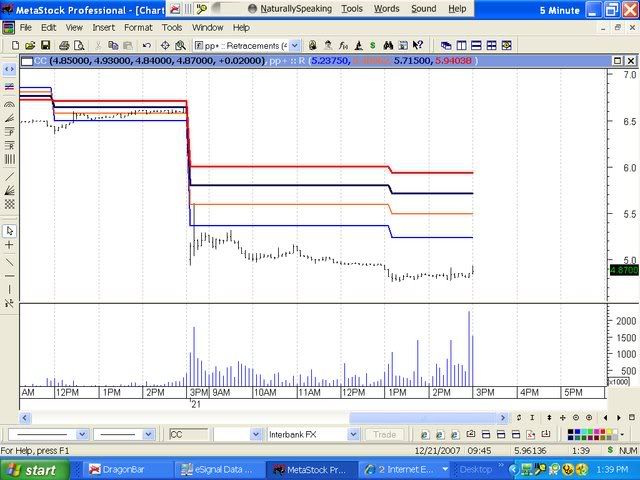
Fuzzy / Muney, I sure will. DID anyone of you guys get some action with -- CC -- ? it had a very nice pull back and then down it went.
The following is a chart on -- CC -- very nice set up for a short.
Thanks for the stock alert's. chuck Posted by wdcisco on :
Did you short it?
Posted by chuck9 on :
Cisco, I sure did. I thought the way it looked this morning. Some of you guys would have shorted it also. In premarket hours, I saw the stock coming back up. So I put a four point retracement on it when it opened up this morning. It retrace back up , around 38%. It was in this area that I pulled the trigger. Then the bottom dropped out. chuck
Posted by wdcisco on :
I've never shorted anything before... If you don't mind can you show me what you mean... "four point retracement"
How do you do your scans? Any info is much appreciated Posted by chuck9 on :
Cisco, there will be two photos following. One is the chart with the four retracement lines inbeded into it, the other will be a retracement perimeter guidelines chart.
Start at the bottom of the first photo were you see the blue line of the retracement. This will be the 1% line, use the chart photo as you work your way up.
I had an era in the previous post of 38% retracement. It should have been 2% retracement= .38 cents.
Answering the question how I pick. I have built a formula that looks at the premarket hours versus the previous day's low, high and close in percentage difference . Example: on this particular chart. The percentage difference in premarket hours was 26% lower than its previous days close.
Hope the above information helps. If you have any problems with the above information, feel free to give me a post until we can work it out.
chuck
Posted by wdcisco on :
Excellent...I am starting to understand..Thanks a lot.
Coupla questions:
Why was this 38% retrace a key number for you?
Is it fibonacci?
I'm guessing it was major resistance...so it was key to short there...
-wdcisco
Posted by chuck9 on :
Cisco, look at the following chart of Circuit City. You will see a red arrow. This is one of three reversal signals with confirmation that I received plus the retracement line, that the stock should reverse to the downside from this five-minute bar.
You will also notice that there are a big red line and a big blue line. This is a moving average band. As long as the stock stays below the red line you are in a downward mode.
Another reason is look at the black perpendicular line, follow it to the top and you will see another other indicator, which is a trend indicator. You will notice that the black or blue line of this indicator is below the center red line and moving down. This also took place at the same time that I got the reversal signals or red indicator and the retracement reading.
This was the reason I went in at that particular time. Now if you will notice. Look at the big red line, which is part of the moving average band and follow it to your right, you will see that the stock is under the big red line until you see the green indicator reversing to the upside.
This is how I traded this stock. And yes the retracement lies or --- Fibonacci ---.
chuck Posted by wdcisco on :
Thanks Chuck...! Great lesson.
When I start shorting I'll post you.
Have a Merry Christmas!
-wdcisco
Posted by chuck9 on :
Glad you enjoyed it.
You and your family have a great and safe holidays.
chuck
Posted by chuck9 on :
ABK -- put in an order to buy at 24.60. The high so far today is 27.48. has an average true range per day of around three dollars. ------------------------------------------------ In regards to possible legal issues, be advised:
The above information is not a recommendation from myself to others to buy or sell, nor does it provide to other individuals a recommended timeframe for the entry,exit for a stock transaction.
Any individual can use the information as they so choose, but in doing so, that individual accepts full responsibility for results from the use of the information. ------------------------------------------------------ I, Chuck, can accept no responsibility or liability for any other person's use of the information for their personal trading. -------------------------------------------------------------------------------- ------------ chuck Posted by chuck9 on :
Just cancel my order, do not see it making the average true range today. chuck Posted by chuck9 on :
Could not find one thing this morning, while scanning in premarket hours.
Tried to short -- SOLF ---but to no avail, no shares available. Also looked at --- ABk --- and --- Circuit City ---still could not see any possibilities. Maybe tomorrow will be better. chuck Posted by chuck9 on :
STSA-- premarke readings --- down 9.25% from the previous day's low ---- price 17.75 low-volume. Decreased in fourth-quarter earnings.
Posted by chuck9 on :
STSA --- this one was a little tough, because the volume was low. After everything was said and done. It worked out okay. .
I also had some full with --- SOLF --- . This was one of the ones I tried to short, yesterday, but no shares was available. So to get past this I use the average true range indicator to go at the lowest possible point with a buy looking for a $.20 profit on the dollar.
chuck Posted by chuck9 on :
ABK --- thought maybe I would take a look at this and see if the resistance line was still holding. It appears that it is.
It has hit this line 3 times since it has been in a consolidation mode and pull back from the line. Also the top of the Bollinger band coincides with the resistance line. But the price is on top of the 20 day moving average of the Bollinger band.
Even with this, the average true range seems to be around three dollars from high to low during the day. From a look back time span of 14 days.
chuck Posted by chuck9 on :
SOLF --- trying to duplicate the same procedure. I had yesterday using the average true range indicator looking for a bottom,for today. Then will go in with a buy looking for $.20 on the dollar profit. chuck Posted by chuck9 on :
SOLF --- did not get the bottom ,had to leave the office . chuck Posted by Free Muney on :
chuck so correct me if im wrong, or anyone else for that matter. but barring some wonderful event, the market should be red come monday based on people cashing out losses for tax purposes?
or is that going to be just a fart in the wind so to speak?
i would think end of year would be the time for people to be selling their losers so they can reap the tax write off, so down trending stocks for the year should have bad days come monday/ the month of december? is this true or more theory than fact.
housing is one sector ive been really keeping an eye on, and although friday was bad the past 2 weeks have been relatively flat in contrast to my proposed theoretical sell off...
^^ just thinking out loud. trying to find major yearly market trends to play in the future. comments are encouraged Posted by chuck9 on :
Muney, what I will be looking for is a gap downs in order to pick a short position,and if that sector happens to be in the red. That is just conformation for me. As far as I am concerned. The only way that I will buy will be if the stock has been in a long term consolidation and is trading between the B0llinger bands high and low level. This will not be set in stone for the simple reason news can come out and change the entire aspect of the situation.
MY feelings of the market is there are more negatives than positives, but you must keep in mind that I am a very short-term trader.
The above information is not a recommendation from myself to others to buy or sell, nor does it provide to other individuals a recommended timeframe for the entry,exit for a stock transaction.
Any individual can use the information as they so choose, but in doing so, that individual accepts full responsibility for results from the use of the information.
I, Chuck, can accept no responsibility or liability for any other person's use of the information for their personal trading. -------------------------------------------------------------------------------- ------------ chuck Posted by chuck9 on :
Muney, update to the previous post, when I said I would buy if the stock was consolidating and was in a tradeing range between the Bollinger bands . I also should have said it had to be at a 52-week low.
chuck
Posted by Free Muney on :
ok chuck. so from ur responses i gather that you are a primarily short selling trader. which in this market is undoubtedly smart. when selling on gap downs isnt the risk of the bounce something to worry about or do you wait it out? case in point is etfc made a huge gap down in mid november. i bought for the bounce and made 40% in like 2 days. this bounce is what i imagine u wait out, and sell short after. but for the next few weeks volitility was crazy. and sometimes stocks pull up to fill the gap. what kinds of comformations do you look for seeing that gap downs break any sigificant short term trend lines?
What trading broker do you use. I have found that many stocks once they take a beatdown( gapdown ) my broker wont let me sell them short. Is there also additional restrictions on selling stocks short when they go below $5? seems nearly impossible to short them at those prices. but maybe i just need a different broker.
sorry to pump u for information. this kind of turned into an essay....
p.s. funny disclaimer i wont sue. promise.
Posted by chuck9 on :
Muney, again I do not stay in a stock longer than one day. I use the four point retracement line,Bollinger Band and a moving average band which consists of a 10 ema high and a 8ema low to help me decide when to go in.
I do not think there is a set Cingular indicator that will tell you, when the best time to go in , but from experience. I have found that the above indicators will give you a very good feel when to go in for your short position.
The only time I can not short is if there are not any shares availableor or I do not have the correct amount of money in my account, which is a margin account.I use Ameritrade for my broker.
chuck Posted by chuck9 on :
DISH -- down 13.44% price 32.65 -it would appear that the company has split into.
Posted by chuck9 on :
Muney, did you get into this one? Had a very nice run to the down side. chuck Posted by Free Muney on :
i did not realize u are an intraday trader. i dont wake up early enough to do this successfully. being on the west coast, and a lazy bum my trading starts around noon east coast time. although i am always looking for the gap downer picks. so i will keep watching ur moves
my trading is about a week or less holds in hopes for 20% gains. looking into financial sector right now...
Posted by chuck9 on :
Muney, it is like you said you were asleep when the action was going on. chuck Posted by Free Muney on :
hey check out PAY. i can actually short it. gap down today. in at 20.02 still selling off. will probably carry through tomorrow imo.
your TA is appreciated chuck. and comments.
Posted by chuck9 on :
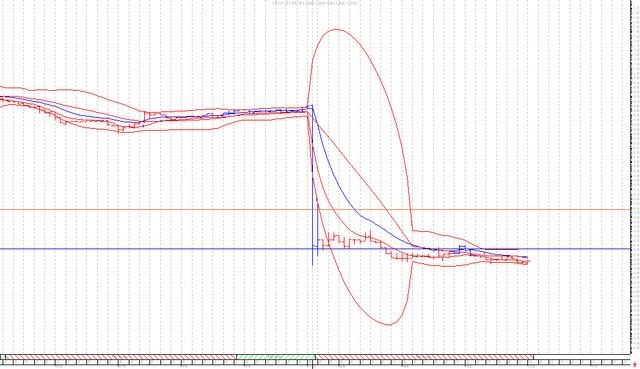
I can see the breakout you are referring to, and this is on a daily chart. The Bollinger bands have came together, which represents very light volatility.
I have not seen a gap with the Bollinger bands in the position that they are in at this time. Without the volatility I cannot tell whether you will have a follow-through or not.
I can tell you that you have a confirmation breakdown from a singular resistant area, and I cannot find any support below. You are also at a 52-week low.
For one to follow this particular set up that you have here,you need to be looking at a intraday chart,five-minute chart.
I realize this does not help very much, but the way the gap came into play and the way the Bollinger band looks. There's no way that I can tell, if you are going to have any follow through,.
------------------------------------------------ In regards to possible legal issues, be advised:
The above information is not a recommendation from myself to others to buy or sell, nor does it provide to other individuals a recommended timeframe for the entry,exit for a stock transaction.
Any individual can use the information as they so choose, but in doing so, that individual accepts full responsibility for results from the use of the information.
I, Chuck, can accept no responsibility or liability for any other person's use of the information for their personal trading. -------------------------------------------------------------------------------- ------------
chuck Posted by wdcisco on :
chuck! I think you may be interested in GOOG'S symmetrical triangle...depending which way it goes it could be a good short or buy.
Posted by chuck9 on :
Cisco,very interesting my man. Especially when I put the Bollinger Band overlay on the chart. Very interesting indeed. Thanks a bunch. chuck Posted by wdcisco on :
No problemo...Hope you make some dough..
I know you use metastock for your charts but what do they run for a subscription? Do you have their site?
I would check on my own..but I couldn't find the site... Posted by chuck9 on :
Cisco, the following is their phone number and website.
phone # --- +1 (800) 882 3040 Open from 7am to 5pm Mountain Time
Any comments on --- CC --- ? chuck Posted by Free Muney on :
comment- i shorted it about a month ago and wish i had held and doubled my investment. yarg!
its getting beatdown by best buy out preforming it big time.
think id wait for a bounce it is extremely oversold...imo
chuck and other shorting investors. housing resuming its downspirial trend. check out dhi today. also phm are the 2 ive been watching the most. mostly very predictible in terms of stocks... these 2 do pay dividends so that is something to be wary of when shorting....
Posted by chuck9 on :
Muney, thanks for the input On --- CC ----also about the housing situation. chuck Posted by wdcisco on :
GOOG looks good for a short here chuck....Broke my traingle up there...
Posted by chuck9 on :
will be watching this one -- goog -- to-day.
There is also a --- M --- pattern that has come into play. If the price breaks the neck line of 652.50, this could be the Conformation for your triangle pattern. chuck
Posted by wdcisco on :
"M" is for murder Posted by chuck9 on :
Did not see anything today in premarket hours. That was worth mentioning.
Just setting here waiting for the quarter reports to start coming out.That's when the formula works best.
Then we will massacre them.
chuck
Posted by Free Muney on :
housing has been a good play past 2 days. bottoming off lower bb especially dhi. might be good for a bounce tomorrow.
what are you watching for quarter reports. are you looking primarily at short plays?
like cc. i was right about the bounce by the way... bet it will take a dive in earnings. housing should be good for a downplay. hopefully will bounce this week. then burn.
Posted by chuck9 on :
Muney, I get both short signals and buy signals from the formula. Since the market is like it is, I have only been posting short signals.
Talking about CC. That was a very good call.
I am still watching the housing and CC. See you in the morning. chuck Posted by chuck9 on :
I scanned 2 or 3 time for premarket picks this morning. Did not find one thing worth mentioning chuck Posted by wdcisco on :
Chuck you don't play gap ups or gap downs???!!
Short or long?
Posted by chuck9 on :
Cisco,when the stock has gap down in premarket hours. Most of the time I will wait until the market opens and the stock pulls back. Depending on the pull back is when I go in for a short position.
Do not do gap ups at this time because of the market conditions. Although I do see gap ups when I run my scans. chuck
Posted by wdcisco on :
Thanks for the info...Will probably be back with more questions later LOL.. Posted by chuck9 on :
10/4 chuck Posted by Bottomfeeder on :
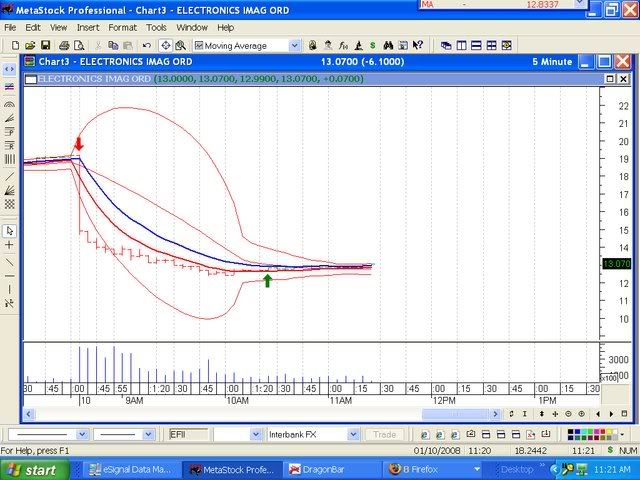
Are you gonna short EFII since it says they wont meet 4th q expectations?
Posted by chuck9 on :
that will depend on the pullback, after the market opens.
Posted by chuck9 on :
bigfoot, did you get in on the sedcond 5min bar?
Posted by chuck9 on :
The following is a chart pattern for this morning on --- EFII ---. Had a range from a high of 15.20 to a low of 12.35.
chuck Posted by chuck9 on :
symbol ---EFII ---
bottomfeeder, had you confused with Bigfoot. Will ask you the same question. Did you get in on the Second 5min bar?. chuck Posted by chuck9 on :
NO picks this morning. chuck Posted by Free Muney on :
new tech down trend? a bunch of the big players in tech. namely nok, rimm, appl are looking bearish long term.
also sbux chart looks about perfect for a shorting swing play imo.
cc is doing weird things today...
Posted by chuck9 on :
nuney, --- CC --- has been strange. chuck Posted by $tock Weazel on :
Weazel, cool name. I don't think I have , but I will . Thanks for the info. chuck. this week.
Posted by chuck9 on :
Weazel, modified the scholastic oscillator to work with the gap down signal. As a point of entry.will give you a chart so you can see where the point of entry comes into play and how long it stays in play.
This has always been my Achilles' heel, where to go in. I realize it will not be perfect all the time, but it will get me in the ballpark a great deal better than what I have been doing.
It still needs to be back tested. Just wanted you to take a look at it
What you will see is a red line going perpendicular, which will be your entry point and then it will start going sideways and then it will move down. This will be your exit point.
look at the second entry and exit point.profit was made on this one also.
Posted by $tock Weazel on :
Hey Chuck,
So your saying short entry would be every time that line jumps up and exit would be when it falls?
Looks good. Any profit is good profit and it adds up SOOO quick...
I paper shorted sgp from 26.95 to 26.04...!!
It pulled up on my trade-ideas realtime scan..
Posted by chuck9 on :
Weazel, that is how it should work. But I need a great deal of back testing before becoming comfortable with it.
If it does work,look out. We're going to town with a wheel barrow full and that is not a wheel barrow of . chuck Posted by Free Muney on :
cc back on the krap track... after some wishy washy moves. cant short it now of course...... all my holdings today are shorted.. and its a good day to be short.
Posted by chuck9 on :
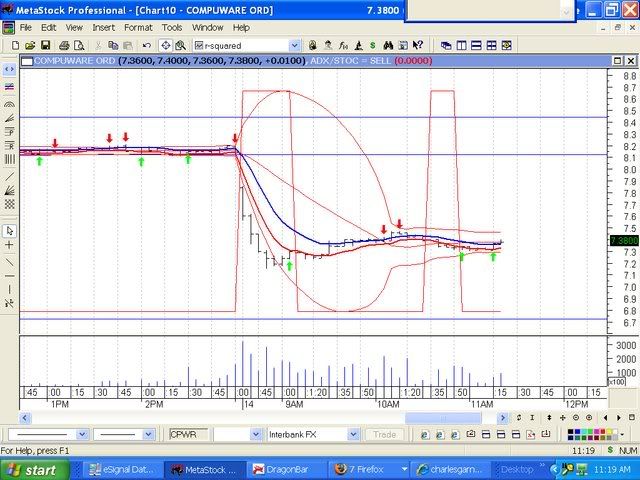
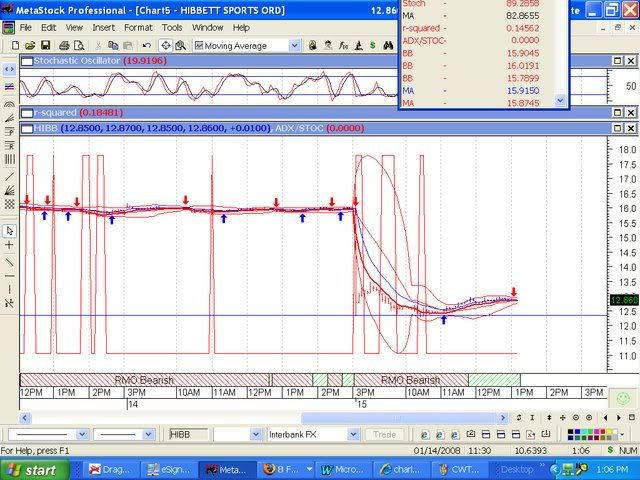
Muney, had some fun with --- HIBB --- this morning. This was one of the ones I posted for a Possib short.
It did have a small pull back. Then down she went.
the other one also went down, but not as much as this one. --- CWTR ---
chuck Posted by $tock Weazel on :
Hey chuck,
At what point did you short HIBB??
Posted by chuck9 on :
Weazel, whent in on a short at 12.89. That was after the pullback. Will give you a chart and you can see why I did this. You remember the scholastic oscillators, tweaking I was doing. It paid off on this one.
I went in on the third vertical line going from left to right. The next vertical line will be a cover signal,but I did not come out, reason being I was still under the big red line, which was my eight EMA lower band. came out at the Green or blue arrow .
Posted by $tock Weazel on :
Nice job!!!! I like how you wait for the confirmation and don't just jump in...
Thanks for the chart! Looks like that new vertical red line thing is working great!
Posted by chuck9 on :
Weazel,I was very nervous yesterday when I did use the Scholastic indicator that I readjusted or the red line. I still think I have a long way to go before I will really trust it.
I was just wondering, does it help to give people the charts, when I am explaining what I am doing. Than rather just talk about it?
Thanks for the complement.
chuck Posted by chuck9 on :
ACE, sorry I have not gotten back to you sooner. I look back at my records and can not find the site that you were questioning about. chuck Posted by chuck9 on :
The above information is not a recommendation from myself to others to buy or sell, nor does it provide to other individuals a recommended timeframe for the entry,exit for a stock transaction.
Any individual can use the information as they so choose, but in doing so, that individual accepts full responsibility for results from the use of the information.
I, Chuck, can accept no responsibility or liability for any other person's use of the information for their personal trading. -------------------------------------------------------------------------------- ------------ chuck Posted by chuck9 on :
INTC --- could not get a handle on this one,thought maybe it might be best to just leave it a long. chuck Posted by chuck9 on :
As it turned out, --- INTC ---was a very good short. I just could not get a good handle on it. chuck Posted by $tock Weazel on :
quote:Originally posted by chuck9: Weazel,I was very nervous yesterday when I did use the Scholastic indicator that I readjusted or the red line. I still think I have a long way to go before I will really trust it.
I was just wondering, does it help to give people the charts, when I am explaining what I am doing. Than rather just talk about it?
Thanks for the complement.
chuck
Chuck,
Yes the charts do help a lot... INTC really didn't do much today except gap-down..lol
See you in the mornin'!
-weazelstock
Posted by chuck9 on :
I copy that. Maybe there will be a better train tomorrow to take us all down to glory land. Posted by Free Muney on :
sprint looks like a chuck special today. at least in terms of gap down action.
Posted by chuck9 on :
it looked very interesting, but I have just now returned to the office. Wish I had been here. Posted by $tock Weazel on :
Screw "the office"....short it and short it good!!
Wheeeeeeeeeeeeeeeeeeeeeeeeeeeeeeee!
Posted by $tock Weazel on :
Oh wait LOL...I just reread your post Chuck and it said 'I have just now returned to the office'...not "from the office"....
I still stand by my words though :
quote:Originally posted by $tock Weazel: Screw "the office"....short it and short it good!!
Wheeeeeeeeeeeeeeeeeeeeeeeeeeeeeeee!
Posted by Free Muney on :
also UA might be good tuesday along with sprint to watch. both have big gap downs.
what do you think the effect will be from bushies tax levy. ps wont this further devalue the dollar causing more economic problems...
imo dow is due for a bounce tuesday.. gonna be waiting till eod to do anymore shorting.
Posted by chuck9 on :
Muney, wish I could help you about the tax question.T he way I trade, it really does not make any difference. I am in and out so fast that has really no effect on the way I trade. I'm sure that swing trading and longer-term held positions should pay heed to it.
Weazel, You are correct about shorting all the way down to the bone. My best trading coms during quarterly reports, and when the market is seesawing back-and-forth. So let the force be with you guys, and hopefully we will all have a great week. Posted by chuck9 on :
are any of you guys tracking this symbol? -- NUAN --. I cannot find anything wrong with it. So I have to assume it is following the market.
Posted by chuck9 on :
Had nuan in my site this morning, was ready to go in. Then the Internet went down, started to call Ameritrade to put in a order. But with the Internet down and my charts were not accessible, decided to stay out. chuck
Posted by chuck9 on :
Premarket hours ---
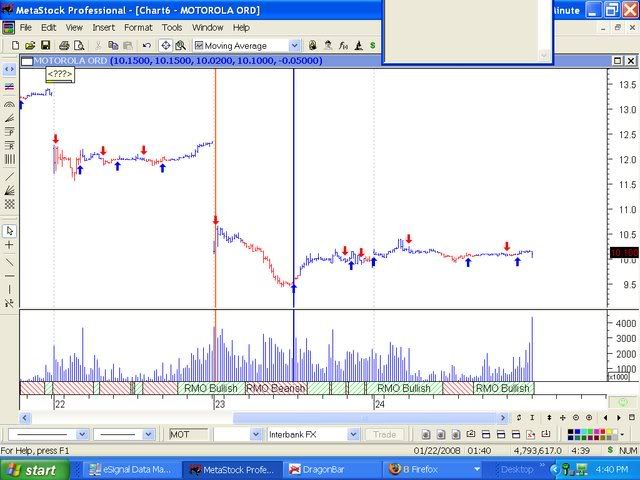
MOT - possible short this morning.
Posted by chuck9 on :
Still having trouble with the Internet. chuck Posted by chuck9 on :
concerning post 281 ---- this is a follow-up on MOT.
was a great short for anyone that took advantage of it.
Following is a chart of entry and exit points. Entry point look at the perpendicular orange line. You also see a red arrow. The exit point is a perpendicular blue line. You also you see a blue or green arrow.
this happened the other day when the stock broke down.
Posted by $tock Weazel on :
Yeah, that would have definently bagged some coin.
I should be staring this week with my daytrading account...
I'll post my entry and exits on your board.
-$w
Posted by chuck9 on :
I copy that, and . Chuck
Posted by chuck9 on :
premarket hours
YRCW - down 17% could be a possible short
Posted by chuck9 on :
ZRAN - possible short
Posted by chuck9 on :
ZRAN - this one did not follow through. chuck Posted by chuck9 on :
Htch - possible short, but watch for a head fake to the upside. chuck Posted by PCola77 on :
LOL. I added HTCH to my watch list, and RJF (which I bought yesterday) was at the bottom of the list beforehand.
I just refreshed my screen and almost had a heart attack thinking RJF was down 27%...
Posted by chuck9 on :
I can see why one would have a heart attack.
When in this morning in premarket hours with a short of 20.00.
One minute chart showed the stock opened at 24.22. The end it drop to around 18 area.
Did not get my short
chuck Posted by chuck9 on :
after all is said and done - HTCH - turned out to be a very nice, short for someone. or
Range 18.46 down to 16.67
chuck
Posted by chuck9 on :
'WOW" --- time 13.24, The range was 18.46 down to 16.67, but as it turned out the range was actually 18.46 down to 16.10. over a two dollars range.
Chuck Posted by chuck9 on :
did not post today working on some new formulas. chuck
Posted by chuck9 on :
premarket hours; Form - down 21%, possible short, watch head fakes to the upside.
chuck Posted by chuck9 on :
Form - follow up from this morning.
Been a long time since I've seen a stock move as this one did. That was some kind of head fake to the upside.
for the ones that played this thing ,you had to come home with a good paycheck.
Posted by BooDog on :
Just wondering if you've been watching MBI and ABK? mbi could have another nice dip.
Posted by chuck9 on :
Boodog - no I have not. But I will now.
Did you follow - FORM - the other day? I guess there are not very many, if any people on this board that trades as I do.
I have put out a great many stocks that were winners, and it does not seem like anyone is taking advantage of it. I have all the charts or most of them showing that they were winners. chuck Posted by chuck9 on :
Boodog, - MBI -, at this point. It is trading at the top of the Bollinger band. It is also Touching against a resistance level are close to a resistance level of around 16.17.
Further examination, I found it to be in between a 10 expotential EMF and a 8 expotential EMF forming a moving average band. As long as it stays in this band,It would be a neutral condition.
It is also above the 20 day moving average of the Bollinger band .
I would be watching the resistance level and the moving average band. This will help give you the key of which way it might move.
As you know it is still in a over/ all down position.
Did not have time to look at the other one.
This one peaks my interest.
Could not find any support level .
Thanks for the info.
-------------------------------------------------- In regards to possible legal issues, be advised:
The above information is not a recommendation from myself to others to buy or sell, nor does it provide to other individuals a recommended timeframe for the entry,exit for a stock transaction.
Any individual can use the information as they so choose, but in doing so, that individual accepts full responsibility for results from the use of the information.
I, Chuck, can accept no responsibility or liability for any other person's use of the information for their personal trading. -------------------------------------------------------------------------------- ------------ chuck Posted by BooDog on :
Watching SCA right now Chuck. Some analyst thinks SCA could be declared worthless. Tanking right now. Thinking this will bounce like crazy sooner or later. I'll be back!
Posted by BooDog on :
Roger that on MBI Chuck - it has been holding pretty good. I'll have to look at the charts more. Most of its action seems to be afterhours or pre market though. I think they are selling straight to (forgot who - in their PR though) their buyer.
Posted by BooDog on :
quote:Originally posted by chuck9: Boodog - no I have not. But I will now.
Did you follow - FORM - the other day? I guess there are not very many, if any people on this board that trades as I do.
I have put out a great many stocks that were winners, and it does not seem like anyone is taking advantage of it. I have all the charts or most of them showing that they were winners. chuck
FORM is outside my price for profit range but I'll look more into it. You short them down to me to catch at the bottom okay!! LOL
Posted by The Green Demon on :
I will keep and eye on form...I think that this one is close to the bottom as well..
What do you think of ont chuck this should go and go quick IMO
Posted by chuck9 on :
Demon, it would appear that you are in a deafened trading range. Moving sideways.
This range has a high of 1.05 with a low of .80.
Bounded by upside resistance of around 1.11 and downsides support of around .86 the upside resistance seems to be fairly strong, but the downside support is not. The next -support level would be around .80, this is where you're swinging is coming into play.
I also ran the Bollinger band, and it confirms the upside and downside support and resistance. Also if you have the capability of looking at the Bollinger band. Look how the stock is moving with the Center 20 day moving average of the band.
AT this particular time, the Bollinger band is staying at a fairly constant level going sideways. Giving no signal for a breakup or breakdown Salerno.
The above is for a daily chart. chuck Posted by chuck9 on :
MBI, looking for a low to be around 13.60 to 12.96 today.
Posted by The Green Demon on :
quote:Originally posted by chuck9: Demon, it would appear that you are in a deafened trading range. Moving sideways.
This range has a high of 1.05 with a low of .80.
Bounded by upside resistance of around 1.11 and downsides support of around .86 the upside resistance seems to be fairly strong, but the downside support is not. The next -support level would be around .80, this is where you're swinging is coming into play.
I also ran the Bollinger band, and it confirms the upside and downside support and resistance. Also if you have the capability of looking at the Bollinger band. Look how the stock is moving with the Center 20 day moving average of the band.
AT this particular time, the Bollinger band is staying at a fairly constant level going sideways. Giving no signal for a breakup or breakdown Salerno.
The above is for a daily chart. chuck
Thanks for the input! I think that it will take off when it breaks its trading range. The MA's haven't been this bullish in years and the rsi held at 50 on the drop.
Up 8% right now
Posted by chuck9 on :
Boodog and Demon, I hit my prediction parameters for the low of - MBI - today. Post -306 -. Low has been down to 13.54 so far.u:
Posted by The Green Demon on :
quote:Originally posted by chuck9: Boodog and Demon, I hit my prediction parameters for the low of - MBI - today. Post -306 -. Low has been down to 13.54 so far.u:
Looked at this one and it looks like it may slide back towards 10...? Who knows but, I don't love the chart
Posted by chuck9 on :
Demon, MBI is moving between the 10 EMA high and the eight EMA Llow, also it is in the middle of the Bollinger band. The 10 you are referring to is also the bottom of the Ballinger band. I think if it breaks below the 8 EMA with some volume and range there is a good possibility it moving on down to the 10 area.
------------------------------------------------- In regards to possible legal issues, be advised:
The above information is not a recommendation from myself to others to buy or sell, nor does it provide to other individuals a recommended timeframe for the entry,exit for a stock transaction.
Any individual can use the information as they so choose, but in doing so, that individual accepts full responsibility for results from the use of the information.
I, Chuck, can accept no responsibility or liability for any other person's use of the information for their personal trading. -------------------------------------------------------------------------------- ------------
Posted by BooDog on :
quote:Originally posted by chuck9: MBI, looking for a low to be around 13.60 to 12.96 today.
WTG Chuck
I know your rules say get in and get out - Personally I think this will give you more opportunities. SCA was a trip today too down to 1.83 and then bouncing back to 2.18. Some crazy days!
Posted by chuck9 on :
Boodog, I am with you.
You are right, this was a crazy day
Posted by BooDog on :
Check out this report. Time to put some of these puppies on radar. SIRF and ARUN. On Radar.
Have the Sector's Stocks Been Punished Enough? By ERIC J. SAVITZ
HOW LOW IS LOW ENOUGH? that's the question technology investors are struggling to answer.
Report looks very interesting. Are you in SCA?
Posted by BooDog on :
I missed the bounce yesterday. Thought it would go lower also. If I can I'll be watching it today. I need to catch up on the indices also! Trying to catch when everything turns.
The above information is not a recommendation from myself to others to buy or sell, nor does it provide to other individuals a recommended timeframe for the entry,exit for a stock transaction.
Any individual can use the information as they so choose, but in doing so, that individual accepts full responsibility for results from the use of the information.
I, Chuck, can accept no responsibility or liability for any other person's use of the information for their personal trading. -------------------------------------------------------------------------------- ------------
Posted by BooDog on :
Everytime I read your post I keep skipping down to your disclaimer the words "legal issues" make me skip a beat EVERY TIME!! thinking my pick has action against it - LMAO!!! I picked up some SCA for a long term hold. If it drops big time I'll get some more and sell my higher shares later. LOL. This one is a swinger - and if they start the buyout rumors that'll be just fine with me too!
Posted by The Green Demon on :
SCA Looks like it is heading lower to me but I do like the prospects...
Posted by BooDog on :
Yep. If I sell right now and take my loss it will hit my target even faster LOL.
Posted by The Green Demon on :
Just double down in that 1.50 area
Posted by BooDog on :
That was my thought before i bought at 1.99 to just wait. LOL This has already made me money - It'll do it again! Like to see the 1.60 again at least!
Posted by chuck9 on :
SCA -- not sure how low it will go, but will be paying attention, within the time frame. I mentioned. To all.
Posted by BooDog on :
Okay - back to your shorts Chuck!! LOL You short them down to me Kayo??!
Posted by chuck9 on :
SCA -- not sure how low it will go, but will be paying attention, within the time frame. I mentioned. To all.
Posted by chuck9 on :
BOOdog, the past couple of days, could not find anything worth mentioning. Posted by BooDog on :
watch MTG
No One Wants It, But We Need Some Failures
By Jim Cramer
About this article: MGIC reports a hideous, monster loss and what happens? It issues a statement saying it has "adequate capital to meet its claim obligations" and that there have been "significant improvements to the company's business fundamentals." This despite recognizing that it cannot make money in 2008. IndyMac says yesterday that it has all the capital in the world despite a monumental quarterly loss and a suspension of dividend, It, too, has oodles of capital. Both companies, the Alt-A bank of IndyMac and the mortgage insurer MGIC, have non-performing loan numbers that would make me wonder how the heck they can stay in business. But things are going swimmingly, they both say. This stuff is amazing to me. In 1990, both of these companies wouldn't have a dime of funding and would be annihilated, gone, bankrupt. No way they could make it. But in this environment, nobody fails, nobody merges,... http://secure2.thestreet.com/cap/login/rm_mbp_msn_july07_v2.jsp?cm_ven=YAHOO&cm_ cat=PREMIUM&cm_ite=003190&flowid=72d7296f71&url=http%3A%2F%2Fwww.thestreet.com%2 Fp%2F_yahoo%2Frmoney%2Fjimcramer****%2F10403247.html Posted by chuck9 on :
thanks, will keep a eye on this one Posted by chuck9 on :
NILE - down 27%, Price 39.00.
not sure if they have had their quarterly report would what's for a pullback To the upside, because of the market.
Posted by BooDog on :
quote:Originally posted by chuck9: NILE - down 27%, Price 39.00.
not sure if they have had their quarterly report would what's for a pullback To the upside, because of the market.
WOWZERS!
Among the biggest decliners, however, was Blue Nile (NILE - Cramer's Take - Stockpickr), which dove 21.2% after the online jewelry retailer projected first-quarter income at between 11 cents and 14 cents a share, the midpoint of which is 10.5 cents under analyst targets. Blue Nile beat by a penny for the fourth quarter, but shares were nonetheless plunging $11.42 to $42.43 after hours.
Posted by cactus33 on :
Got in ALLT this am on the dip
Posted by searlest on :
CEPH check it out Feds are after these guys
Posted by chuck9 on :
BooDog - did you get some of that pullback. Very nice. I plotted a 4 point retracement line.when it started pulling back and went through the first retracement line, I started to follow it , when it went through the second retracement line. I knew I was in heaven. Posted by chuck9 on :
Searlest, too rich for my blood.
Posted by chuck9 on :
BooDog- disregard comments from post 318,about the second retracement line.
Posted by BooDog on :
CEPH Nice Chuck. Too rich for me too, but for how much longer? LOL. Nice support at 55 and 56. Another base around 52 and then into the low 40's. If the down pressure continues. Could be crazy and go for 38. You didn't say where your lines were?
Posted by BooDog on :
Volume is picking up on ALLT. On radar here. Cheers. Charts stop December '06. Bummer - means I have to look at the fundamentals. LOL Or at least the stochs family for the hook.
Posted by BooDog on :
quote:Originally posted by BooDog: watch MTG [/URL]
Had a nice gap down to 11.80 still may have some downswing imo. Getting some mixed indicators (some trying to save the ship?) but I think the bears will win the battle.
Posted by chuck9 on :
MTG - from what I can see - MtG - broke below the support line , which was 16.11, seven days ago. That support line now becomes the resistant line.
Also, it is still below the moving average band that I have set up, which signifies downward movement, and the stock is still in an overall downtrend.
There, are also a confirm break down below 13 with no support below that. -------------------------------------------- In regards to possible legal issues, be advised:
The above information is not a recommendation from myself to others to buy or sell, nor does it provide to other individuals a recommended timeframe for the entry,exit for a stock transaction.
Any individual can use the information as they so choose, but in doing so, that individual accepts full responsibility for results from the use of the information.
I, Chuck, can accept no responsibility or liability for any other person's use of the information for their personal trading. -------------------------------------------------------------------------------- ------------
Posted by chuck9 on :
Cactus, the only dip I saw was on a five minute chart. I did look at the daily chart, and from what I saw. It appears it is in a downward trend and could not find any reversal signals.
I would really pay attention to this one. -----------------------------------------------
In regards to possible legal issues, be advised:
The above information is not a recommendation from myself to others to buy or sell, nor does it provide to other individuals a recommended timeframe for the entry,exit for a stock transaction.
Any individual can use the information as they so choose, but in doing so, that individual accepts full responsibility for results from the use of the information.
I, Chuck, can accept no responsibility or liability for any other person's use of the information for their personal trading.
Posted by chuck9 on :
Premarket - MDRX - down 24% price 11.60
Posted by chuck9 on :
Mdrx - had a very nice pullback to the upside.
If one likes to trade pullbacks, one could have made money on this one.
Posted by chuck9 on :
SCA -no bottom signal as yet.
Posted by BooDog on :
"SCA -no bottom signal as yet." There's always a bottom somewhere...
Bond insurers have days to re-capitalize, Spitzer says
By Alistair Barr Last update: 12:32 p.m. EST Feb. 14, 2008Print RSS Disable Live Quotes
SAN FRANCISCO (MarketWatch) -- Bond insurers have four to five business days to re-capitalize themselves enough to keep their crucial AAA credit ratings, New York Governor Eliot Spitzer said during a Congressional hearing on the $2.4 trillion industry on Thursday. If that doesn't happen, regulators will have to step in and separate bond insurers' municipal businesses from their more troubled structured finance units. "We will need to move in that direction. It is not our first choice but time is short," Spitzer said. "In the next for or five bus days we would like to see a resolution," Spitzer added. "It's time for deals to get done."
Companies in this story AMBAC Inc (ABK) MBIA Inc (MBI) Aca Capital Holdings Inc (ACAH) Security Capital Assurance (SCA) Blackstone Group L P (BX)
Posted by chuck9 on :
ARRS - price 5.85 - down 28.57% did not meet their quarterly earnings.
Posted by cactus33 on :
ALLT dipped to 2.83 on wed morning, got in and sold yesterday am at 3.00.. onto the next one be well
quote:Originally posted by chuck9: Cactus, the only dip I saw was on a five minute chart. I did look at the daily chart, and from what I saw. It appears it is in a downward trend and could not find any reversal signals.
I would really pay attention to this one. -----------------------------------------------
In regards to possible legal issues, be advised:
The above information is not a recommendation from myself to others to buy or sell, nor does it provide to other individuals a recommended timeframe for the entry,exit for a stock transaction.
Any individual can use the information as they so choose, but in doing so, that individual accepts full responsibility for results from the use of the information.
I, Chuck, can accept no responsibility or liability for any other person's use of the information for their personal trading.
Posted by chuck9 on :
Cactus - nice job man.
Did you get in on the pullback this morning ?
Symbol was - ARRS -
Posted by BooDog on :
SCA base forming. S&P posted a HOLD. LOL it's holding!
Posted by chuck9 on :
The five-minute chart seems to be holding between the area 1.56 through 1.60. On the other hand, the daily chart is still showing a downward trend. The intraday range from high to low is very narrow.
I still have not seen any reversal signal, Although I think we are not very far from it. Maybe the next two or three days will give us better direction.
Posted by BooDog on :
picked up some at 1.58. We'll see what happens.
Posted by stocktrader22 on :
Chuck I respect your daytrading and advanced charting, but I still say you can do a couple day trade with relatively no chart analysis and more market and investor sentiment.
Posted by chuck9 on :
Stocktrader, I cannot say whether you are right or wrong, I can only say that I have been doing this particular trading for many years, and I have just now begun to understand how to trade this particular style, and it has been very successful for me.
After saying that, I do look at other things besides just the charting aspects.
Posted by lostone on :
what's the update on SCA chuck?
Posted by BooDog on :
quote:Originally posted by lostone: what's the update on SCA chuck?
IMO this will go sideways with not much action untill it gets some decent news. I think these analysts don't even have a clue and S&P doesn't know that much more of what these companies are made of and who they have insured whether it be municiples or sub-prime. So we sit and wait for some high profiled somebody to flinch. LMAO. And no - I have no clue either!
the smartest thing I ever observed chuck9 do was take my advice and follow thelion.com.....it beats Jim Cramer or IBD...that's for damn sure....so for that I can at least say chuck is probably the smartest kid in the 8th grade with his metastock software
Now if only Pcola can take my advice and quit bashing Lionmaster
Posted by $tock Weazel on :
quote:Originally posted by Ace of Spades:
quote:Originally posted by $tock Weazel: Where the hell did you go Chuck?
Weazel....He was a 14-Year Old with metastock software
I called it from day one....he never had any clue what he was talking about...he missused the basic stock lingo/terminology all the time
He claimed he left the old message board because they didn't do his style of trading....which he calls "hit and run" LoL...what a clown...
I asked him several times what message board or forum he was refering to but he never answered..
After me posting about lionmaster and thelion.com several times he finaly sgined up under the same name...
His first post he asked if anbody did "hit and run" trading LoL
the smartest thing I ever observed chuck9 do was take my advice and follow thelion.com.....it beats Jim Cramer or IBD...that's for damn sure....so for that I can at least say chuck is probably the smartest kid in the 8th grade with his metastock software
Now if only Pcola can take my advice and quit bashing Lionmaster
I know you didn't like him from the start...but come on an 8th grader??? Maybe an 8th grader on japanese race horse steriods.
I just value honesty.....that's why I liked you "from the start" you are honest with everyone and especially yourself! Posted by $tock Weazel on :
Touche.
Thanks!! Right back at ya.
Like my new siggy?
-Weazel
Posted by BooDog on :
We've been had??? lmao. There was some potential imo. My nephew was playin the putter at what 2 1/2 3 years old?? Lil kid is turning out to be a master mind - and he's into sports too so not just a putter tatter. If my brother started showing him stock charts he'd prolly pass me in no time!

![[Wink]](wink.gif) (the ants gone)
(the ants gone)![[Big Grin]](biggrin.gif)
![[Frown]](frown.gif)

![[Smile]](smile.gif)


![[Eek!]](eek.gif)

![[Confused]](confused.gif)


![[Razz]](tongue.gif)
![[Were Up]](graemlins/wereup.gif)
![[Cool]](cool.gif)
![[Good Luck]](graemlins/goodluck.gif) this week.
this week.
![[More Crap]](graemlins/morecrap.png) .
.
![[Wall Bang]](graemlins/wallbang.gif)
![[BadOne]](graemlins/headbash.gif)
![[Were Down]](graemlins/weredown.gif)